A comprehensive market analysis for investors evaluating Cleveland and Northeast Ohio. Prepared by Amanah's research team — data drawn from Redfin, Zillow, RentCafe, the U.S. Census Bureau, and industry research.
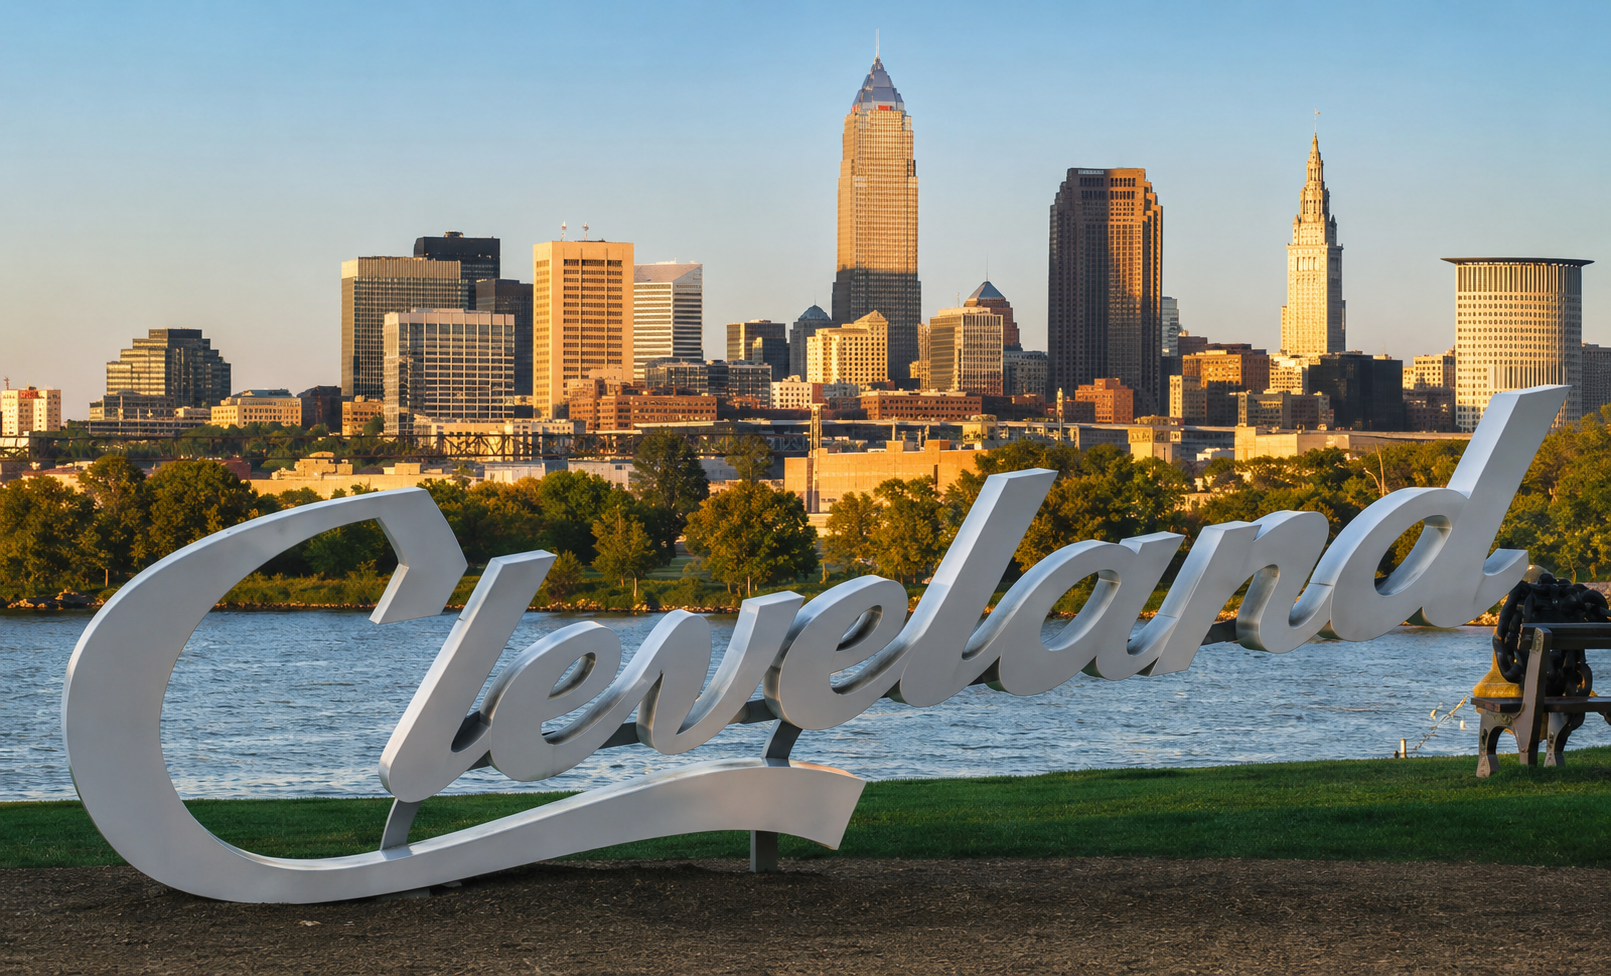
Why national investors continue to evaluate Cleveland.
Cleveland occupies a distinct and increasingly compelling position in the national real estate investment landscape. In an era of compressed yields and fierce competition in gateway markets, Cleveland presents a counter-narrative serious investors are no longer dismissing.
The city's median home sale price of ~$142,000 sits roughly 67% below the national median — a disparity that creates entry-level economics unavailable in virtually any other major metropolitan market. Unlike markets where low prices reflect structural decline, Cleveland's affordability coexists with genuine rental demand, measured appreciation, and an economic base diverse enough to weather cycles that devastate single-industry cities.
01
Affordability at Scale
The gap between Cleveland and national averages is among the widest in the U.S. — meaningful cash-on-cash returns are achievable at $150K–$400K total capital.
02
Resilient Rental Demand
Average rents reached $1,561/mo by mid-2025 with year-over-year growth placing Cleveland among the top 5 nationally.
03
A City in Active Transition
Since 2013, 6.6M+ sq ft of downtown commercial space has been converted to residential — nearly 4,000 units delivered, 1,500 more in the pipeline.
Important Disclaimer. This guide is provided for educational and informational purposes only. All data is drawn from publicly available third-party sources and subject to change. Nothing in this document constitutes investment, legal, financial, or tax advice. All real estate investment carries risk. Conduct independent due diligence and consult licensed professionals before making investment decisions.
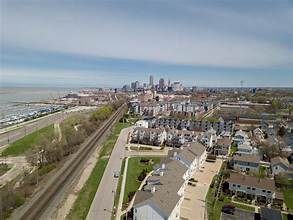
DOWNTOWN ANCHOR
Terminal Tower remains the visual anchor of a city in reinvestment.
CLEVELAND BY THE NUMBERS
The metrics that define the market.
77,000+
Cleveland Clinic Employees
12,500+
Case Western Students
$142K
Median Home Price
5.9%
Annual Appreciation
90%+
Downtown Renter Occupancy
6.6M sq ft
Adaptive Reuse Development
92.5%
Multifamily Occupancy
150K+
Manufacturing Jobs
EMPLOYMENT BASE
A diversified economy that doesn't depend on one industry.
Healthcare anchors the city. Universities supply consistent rental demand. Manufacturing and logistics provide a deep working-tenant base. Corporate HQs round out the top of the rental market.
Parker Hannifin · Lincoln Electric · Eaton · TransDigm
Advanced manufacturing anchors
Amazon · FedEx · UPS
Logistics & distribution hub
THE SHIFT BACK TO CASH FLOW
Why investors are looking beyond the Sun Belt.
We aren't suggesting Tampa, Phoenix, Austin, or Charlotte are bad markets — but at today's entry prices, those markets compress yields to levels that no longer support cash-flow underwriting. Here is the math, side by side.
Market
Median Price
Avg Rent
Gross Yield
Price-to-Rent
Cleveland, OH
$142K
$1,561
10%+
~13
Pittsburgh, PA
$232K
$1,450
7–8%
~17
Memphis, TN
$185K
$1,495
8–9%
~14
Tampa, FL
$378K
$2,100
5–6%
~22
Charlotte, NC
$385K
$1,895
4–5%
~24
Phoenix, AZ
$445K
$1,950
4–5%
~26
Austin, TX
$540K
$2,050
3–4%
~28
Data compiled from Redfin, Zillow, Rentometer, and Global Investments Inc. (May/June 2026). For illustrative comparison only. Actual yields vary by property, condition, neighborhood, and management.
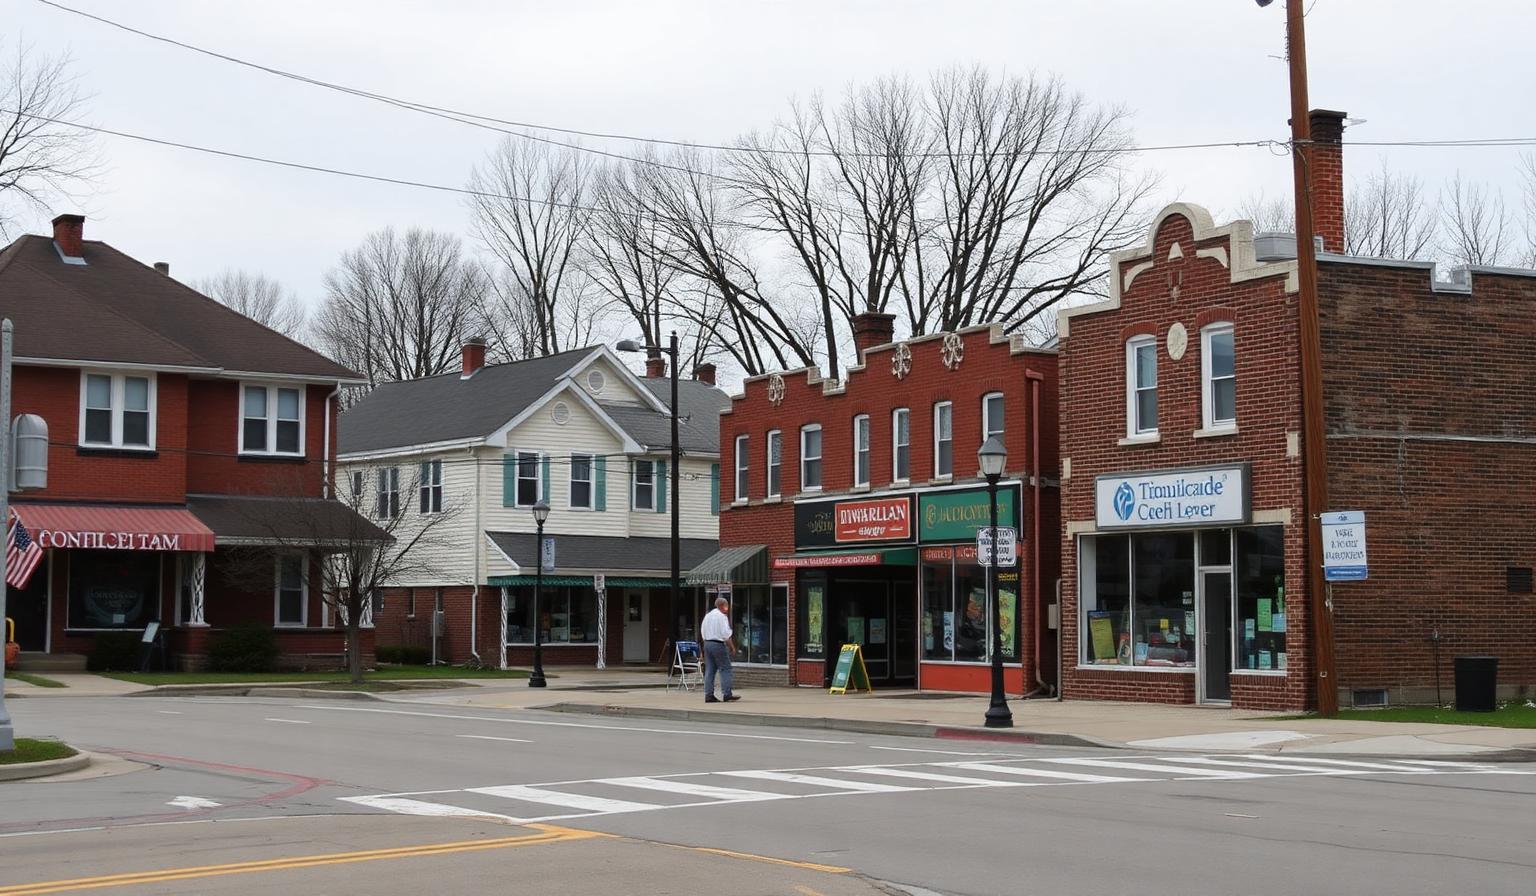
EMERGING OPPORTUNITY
Cleveland's adaptive reuse boom.
Since 2013, Cleveland has converted or is renovating more than 6.6 million square feet of commercial space into residential — nearly 4,000 units delivered with 1,500 more in the pipeline.
The halo effect on surrounding blocks is where individual investors participate: when a former factory becomes 112 loft apartments, it activates 8–10 square blocks as a destination — driving demand for single-family rentals, small multifamily, and fix-and-flip properties within walking distance.
The Centennial
925 Euclid Ave · 584 units · largest single conversion underway downtown · $120M+ private investment.
Terminal Tower Residential
12 floors of the city's iconic 52-story landmark converted to apartments — signal of downtown's residential confidence.
Warner & Swasey Factory
$64M MidTown Cleveland redevelopment — 194,000 sq ft former factory · 140 apartments + 20K sq ft retail.
Project Scarlet
$120M conversion of former Medical Mutual HQ at 2060 E. 9th — 154 apartments + ground-floor retail.
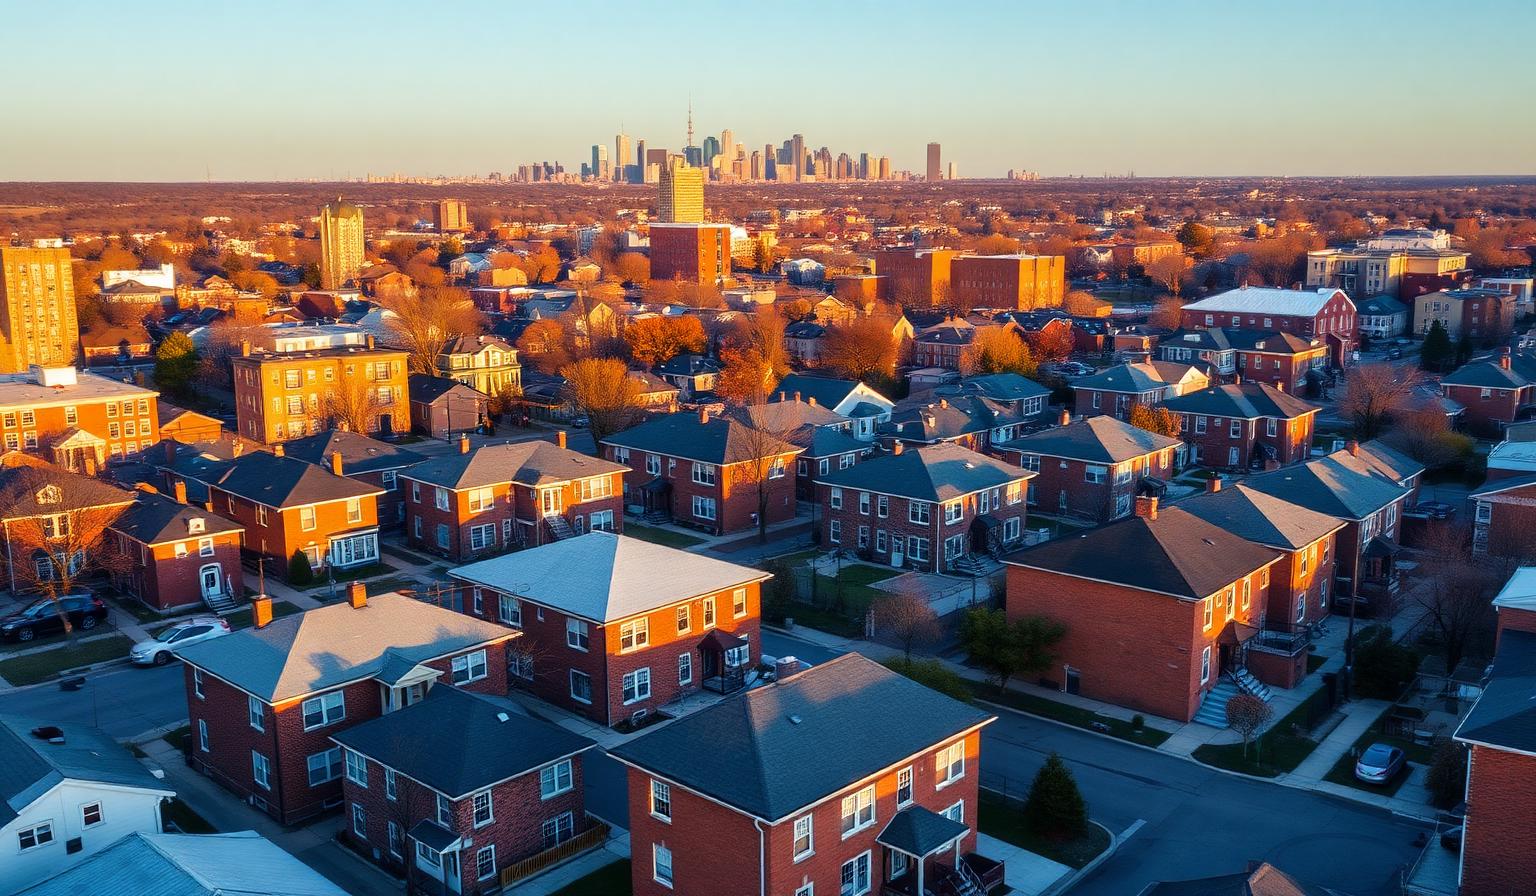
NEIGHBORHOOD INTELLIGENCE
Where to look — and what to expect.
Cleveland is not one market — it is a dozen sub-markets with dramatically different price points, tenant profiles, and operating realities. Here's an orientation to ten of the neighborhoods serious investors evaluate most.
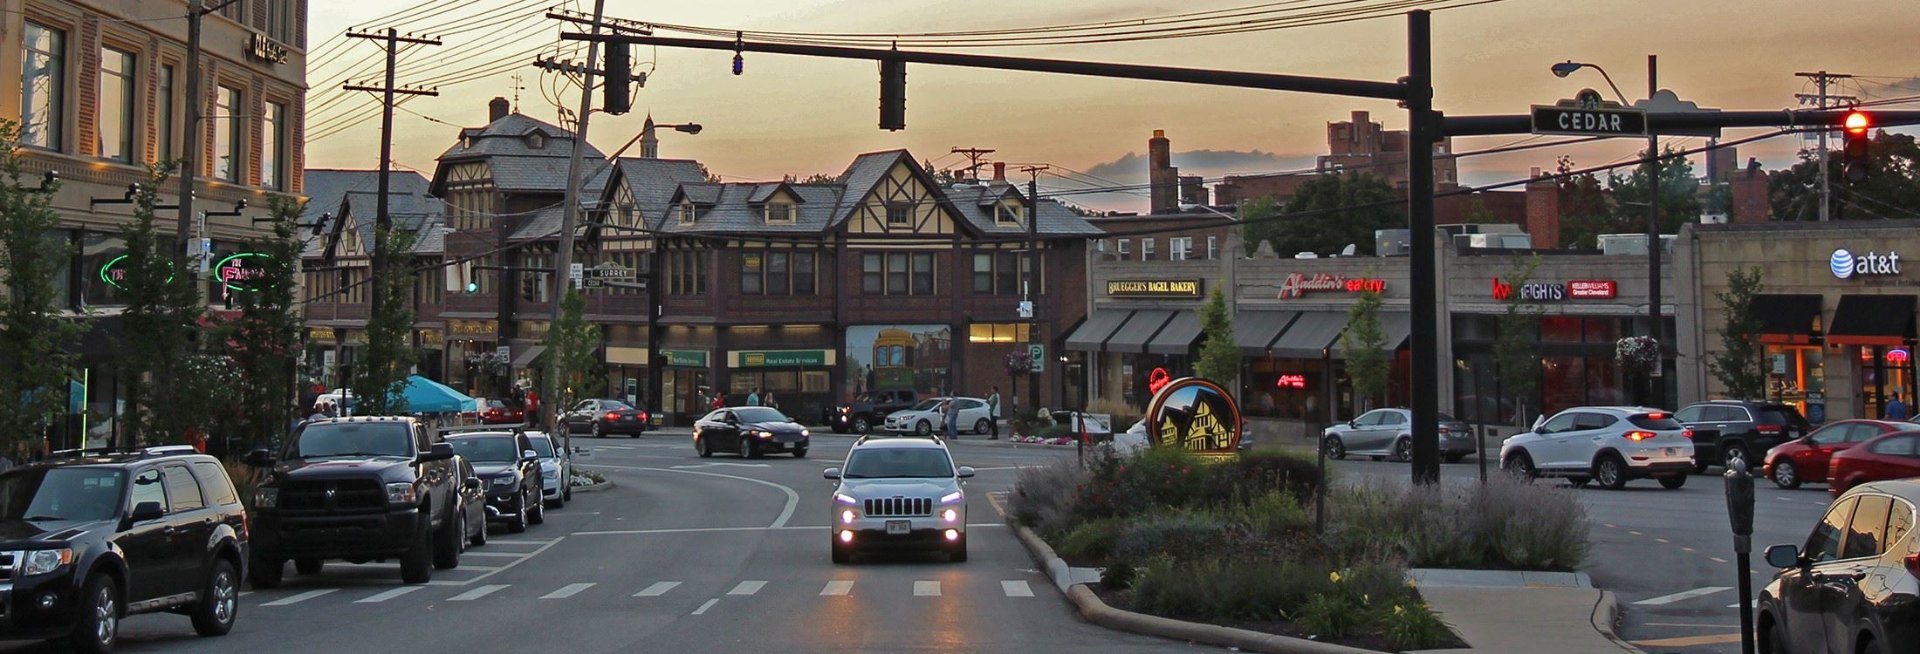
Ohio City
+7.0% YoY
West Side Market anchors a walkable, food-forward district 10 minutes from the Cleveland Clinic. Competition is meaningful; finish quality matters.
Median
$166,700
Strategy
Buy-and-hold, value-add renovation, ADU
Target
$150K–$280K · quality-focused
Tremont
Upper tier
Cleveland's arts district — Victorian homes, converted lofts, and a top-rated restaurant corridor on Professor Avenue. Best suited to top-of-market rents.
Median
$349,896
Strategy
Upper-tier flip · premium buy-and-hold
Target
Experienced renovator
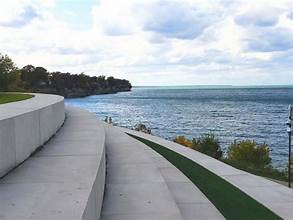
Detroit Shoreway
Active corridor
Gordon Square Arts District + Edgewater Park drive demand. Block-by-block variation is significant — concentrate within 4–6 blocks of Detroit Ave.
Median
$140K–$280K
Strategy
2-family, value-add, loft-style renovation
Target
$120K–$220K · buy-and-hold
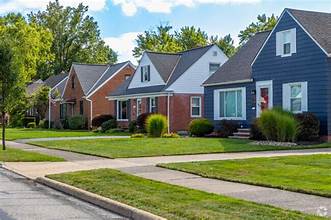
Old Brooklyn
Stable
Stable, family-oriented, deep community identity. Lower vacancy risk. Tenants stay long. Limited appreciation upside — pure cash flow play.
Median
$160,000
Strategy
Long-term rentals · entry-level flips
Target
$80K–$160K · income-focused
Glenville
Value-add
Lowest entry prices in the city. Requires elevated due diligence and strong local contractor relationships. Upside for operators who execute.
Median
~$121,000
Strategy
Entry buy-and-hold · Section 8 · BRRRR
Target
$60K–$120K · operationally experienced
South Euclid
Spillover demand
First-ring East Side suburb benefiting from University Circle spillover. Strong CWRU graduate and medical tenant base. Active code enforcement.
Median
$130K–$185K
Strategy
Single-family, 2-family, BRRRR
Target
$110K–$180K · buy-and-hold
Cleveland Heights
+6.4% adj.
Tudor, Colonial, Craftsman — architecturally rich, walkable. Highest property taxes in the county; underwrite carefully.
Median
$200K–$335K
Strategy
House hack · premium SFR · flip
Target
$150K–$280K · experienced
Lakewood
Competitive
Walk Score 80+, Lake Erie access, fast inventory turnover. Older housing stock — renovation underestimates ruin deals.
Median
$190K–$320K
Strategy
2-family house hack · vintage 4–10 unit
Target
$180K–$300K · experienced
Mayfield Heights
Steady
Middle of the bell curve — consistent operating performance, manageable vacancy, professional-tenant base near the Clinic.
Median
$180K–$260K
Strategy
SFR + small multifamily
Target
$150K–$230K · stability-focused
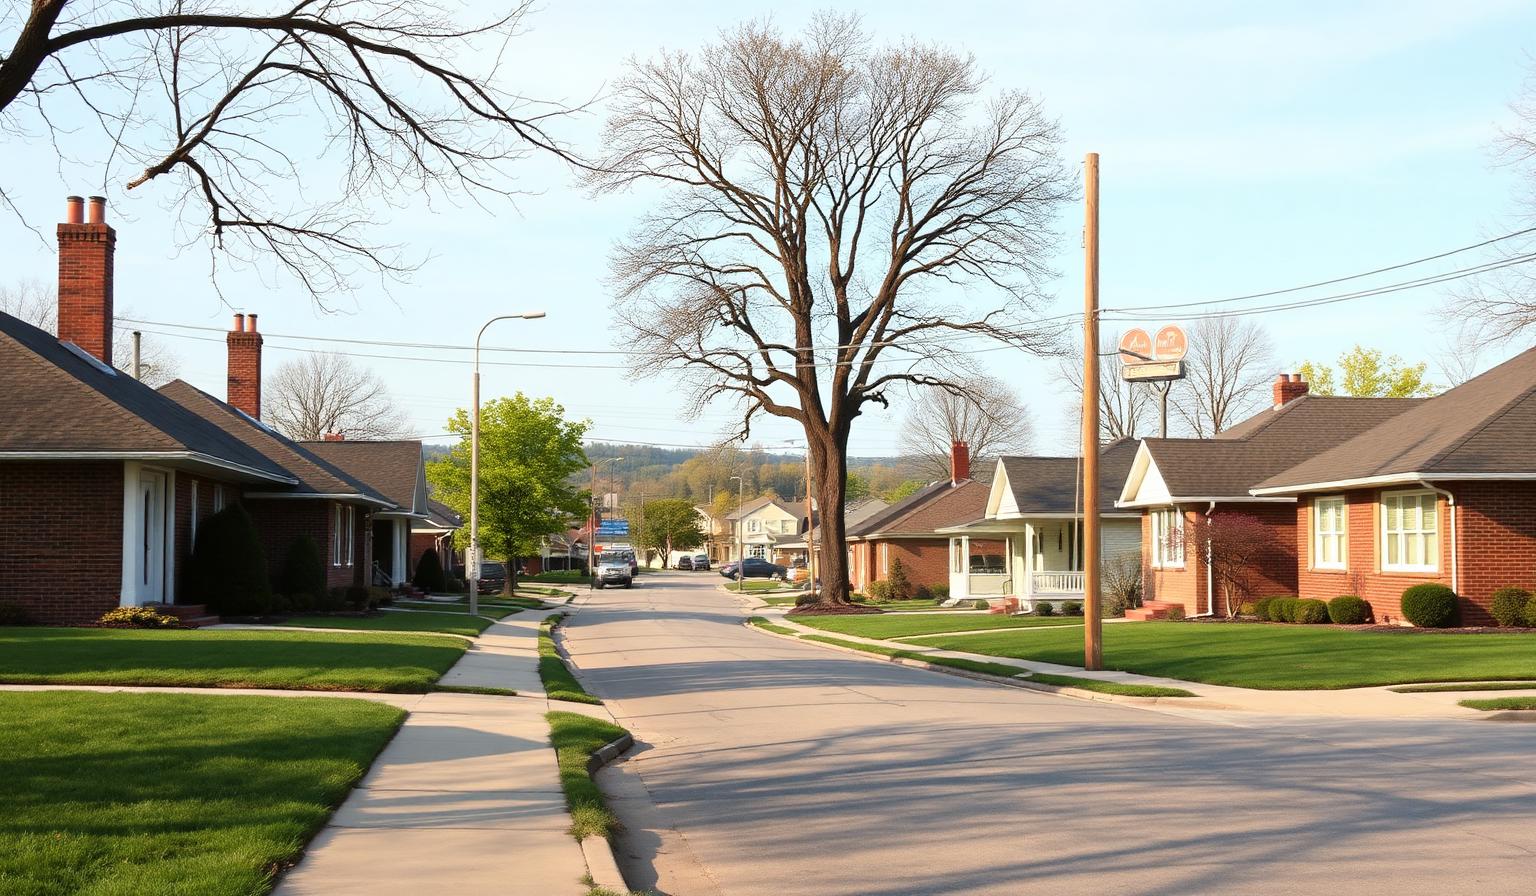
Parma
Patient hold
Largest suburb of Cleveland (78K residents). Yield over appreciation. Predictable, owner-occupied majority maintains neighborhood quality.
Median
$140K–$215K
Strategy
Long-term buy-and-hold · voucher rentals
Target
$110K–$190K · income-first
Neighborhood profiles are orientations, not recommendations. Pricing and rental performance vary by block. Conduct property-specific due diligence with qualified local professionals.
INVESTOR SCENARIOS
Three approaches. Three sets of numbers.
Hypothetical examples for educational purposes only. They do not represent actual transactions or guaranteed returns. Actual costs, rents, appreciation, and outcomes vary widely.
Scenario A — Entry-Level Buy-and-Hold
First-time investor · stable East Side working-class neighborhood
Purchase Price
$95,000
Renovation Budget
$35,000
Closing & Holding
$8,000
Total Investment
$138,000
Monthly Rent
$1,050–$1,200
Annual NOI (est.)
$7,600–$9,400
Cash-on-Cash (25% down)
8%–12%
Succeeds with accurate renovation scoping and conservative rent assumptions. Fails when older-home costs are underestimated.
Scenario B — BRRRR (Value-Add)
Experienced investor · distressed property · transitional East Side
Purchase (distressed)
$65,000
Full Renovation
$55,000
Holding/Closing
$7,000
Total Capital In
$127,000
ARV
$160K–$185K
Cash-Out Refi (70% LTV)
$112K–$129.5K
Capital Remaining
$0–$27K
Lives or dies on ARV underwriting and renovation execution to the appraiser's expectations.
Scenario C — Fix-and-Flip
Experienced investor · West Side or first-ring suburb · owner-occupant resale
Purchase Price
$85,000
Renovation Budget
$65,000
Carrying (6 mo @ 10%)
$12,750
Selling Costs
$14,000
Total Project Cost
$176,750
Target ARV
$215K–$235K
Return on Capital
~21%–33% pre-tax
Timeline overruns multiply carrying costs. Scope must match buyer expectations in the target bracket.
EXECUTION RISK
The deal you underwrote isn't the deal you'll close.
Cleveland's opportunity is real. So are the operational risks. Here's the honest list.
RISK AWARENESS
What can go wrong — and how to prevent it.
01
Contractor Problems
The #1 reason out-of-state projects fail. Use licensed/insured trades, milestone-based payments, lien waivers, and on-site verification before releasing funds.
02
Budget Overruns
Pre-1970 housing stock hides knob-and-tube, lead, asbestos, failing sewer laterals. Always order a sewer scope. Budget 15–20% contingency.
03
Vacancy & Slow Lease-Up
Pricing Glenville at Ohio City rents costs two months of rent. Comp by sub-market — not by city averages.
04
Property Tax Surprises
Cuyahoga averages 1.6–2.4% of assessed value (35% of market). Reassessment after renovation can add $1–2K/yr.
05
Permitting Delays
Cleveland's permit process is historically slow. Six weeks of permit lag = $1,100+ in carrying cost on a typical deal.
06
Poor Neighborhood Selection
Three blocks separate two completely different investment environments. Walk the block at different times. Check code violations.
PROJECT MANAGEMENT
Why oversight is not optional.
A renovation coordinates 6–12 different trades on a sequenced timeline. Each trade depends on the previous. Change orders arise from conditions you couldn't see at purchase. Permit inspections gate the next phase.
For an investor based in Chicago, New York, Atlanta, or Houston, managing this from 400–1,000 miles away without a trusted local representative is extraordinarily difficult. Investors who try it consistently report the same outcome: twice as long, 20–40% over budget, lower quality than planned.
The cost of professional project management is almost always less than the cost of a single poorly managed project.
INVESTOR RESOURCES
The Cleveland investor readiness checklist.
A practical field guide for evaluating Cleveland investment properties with confidence. Download the full checklist alongside the PDF version of this guide.
Define investment goal: buy-and-hold, BRRRR, flip, or multifamily
Establish total capital budget (acquisition + renovation + carrying + contingency)
Identify financing: cash, conventional, DSCR, hard money, private
Research target neighborhoods at the block level — not just the zip code
Order sewer scope + electrical inspection on every pre-1970 property
Pull actual tax bill from Cuyahoga County Auditor (not estimated)
Get a contractor walk-through before finalizing your offer
Comp rents by sub-market with current leases — not city averages
Stress test: cost +20%, vacancy +3 months. Does it still pencil?
Cleveland's combination of healthcare-anchored employment, university density, adaptive-reuse momentum, and genuinely low entry prices keeps it near the top of serious investors' consideration sets.
Amanah Research & Market Intelligence · 2026
Is Cleveland still a good investment market in 2026?
By objective measures, yes. Cleveland continues to rank among the nation's top markets for rental yield, affordability, and investor activity, with rent growth outpacing the national average for two consecutive years. Results depend on property selection, neighborhood, purchase price, and management. Due diligence and local support are not optional.
What's the typical all-in cost for a Cleveland rental?
Entry-level buy-and-hold projects in stable working-class neighborhoods typically total $130K–$160K all-in (purchase + renovation + closing). BRRRR deals in transitional neighborhoods can run $115K–$140K. Higher-quality West Side or first-ring suburb properties run $180K–$300K.
How do property taxes work in Cuyahoga County?
Ohio assesses at 35% of market value. Effective rates in Cuyahoga County run 1.6–2.4% of assessed value. After renovation and reassessment, expect your bill to rise — build this into your underwriting from day one.
How does Cleveland compare to Sun Belt markets?
Sun Belt markets (Phoenix, Austin, Charlotte, Tampa) have led on appreciation and population growth, but entry prices now compress yields to 3–5% gross. Cleveland delivers 8–10%+ gross yields at $140K entry points — fundamentally different math for cash-flow-oriented investors in today's rate environment.
Can I really invest in Cleveland from out of state?
Yes — many investors do. The key is assembling a trustworthy local team: a licensed Cleveland contractor, a property manager who knows the sub-market, and an owner's representative who provides accountability during renovation. Investors who skip the owner's rep are the ones who lose money remotely.
What's the biggest underwriting mistake investors make?
Underestimating renovation cost on pre-1970 housing and over-projecting rents based on city-wide averages instead of sub-market comps. The third mistake is paying contractors upfront and losing leverage to enforce timelines and quality.
Next Step
Ready to Discuss Your Investment Goals?
Tell us what you're trying to build. We'll walk you through the opportunities in Cleveland and Northeast Ohio that fit your strategy and budget.